Last updated and reviewed: January 2024
Time needed to execute: 30 minutes
Skill level: Beginner to Intermediate
Background
Data Studio is now Looker Studio. Looker is a free tool that allows you to turn GA4 data and KPIs into powerful & interactive reports. With Looker Studio, you can easily report on data from a wide variety of sources including Google Ads, Analytics, Display & Video 360, Search Ads 360 Google consumer products, such as Sheets, YouTube, Search Console and Social media platforms such as Facebook, Reddit, and Twitter.
If you’ve been using the “free” version of Google Data Studio, nothing changes for you except for the name of the product you’re using with one caveat*.
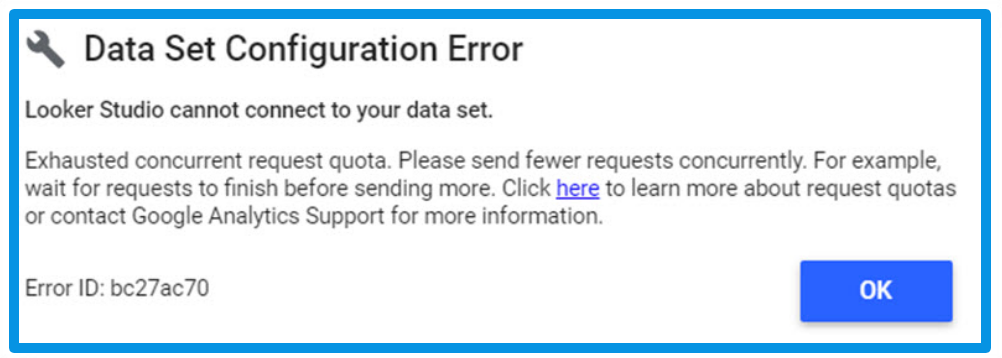
*Starting November 7, 2022, Google rolled out an update that limits the number of requests you can make when viewing your GA4 data using Looker Studio. The more data you want to view will increase likelihood of quotas being exceeded.
Note that the limits are on the GA4 property, not the Looker Studio report. If you don’t have the budget to upgrade to a premium service like Google Analytics 360 or lack the resource to deal with the technical issues involved when using BigQuery then I recommend optimising your Looker Studio reports so that you make fewer requests when viewing GA4 data.
Reduce the number of requests by:
- Only include the charts you need in a report and include fewer charts per report so that you don’t refresh more data connections than you absolutely need to.
- Avoid increased quota usage by keeping the 1,750 tokens per hour top of mind.
- Limit the number of users the report is shared with to only those that need it.
- Leverage the Google Analytics Token Usage tool to keep an eye on the number of tokens your report is using, and which components are using more tokens than others.
- Optimise/Reduce the Looker Studio data refresh rate.
- Share the report with only those who need it.
- Read more here
How To Effectively Integrate Looker Studio And GA4
Step 1: Log in to Looker Studio
- Open Looker Studio here.
- Click “Use It For Free.”
- Enter your GA4 credentials to log in (if you’ve previously created reports in Looker Studio you can skip ahed to Step 3 below).
⚠️Enure you have Administrator or Editor privileges on the GA4 account that you want to create a looker dashboard report for.⚠️

Get Instant Lifetime Access To The Complete GA4 Toolbox (Genius Edition).
Jam Packed With GA4 Marketing Gems Your Competitors Are Clueless About.
Step 2: Set Up Your Account (first use only)
🖱 Step 2.1 – Click the +Create button in the top left corner

🖱 Step 2.2 – Then click “Data Source” and proceed to complete your Data Studio account setup by: Choosing your Country from the dropdown list. Fill in your Company details (optional).⚠️Warning: you cannot change this later.
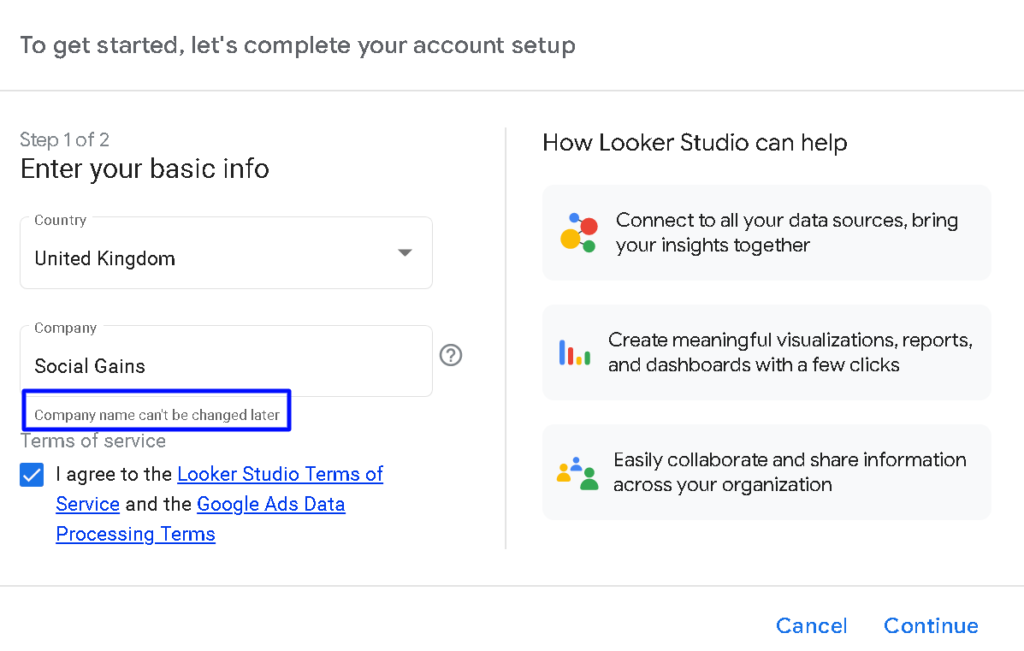
🖱 Step 2.3 – Agree with the Terms of Service.
🖱 Step 2.4 – Click Continue to go to the next step
🖱 Step 2.5 – Check your email preferences
🖱 Step 2.6 – Click Continue. Go to Step 4.
Step 3: Create a Data Source
Step 3.1 Click the +Create button in the top left corner and click “Data Source“.

Step 4: Choose GA as Connector Type
🖱 Step 4.1 – Change the “Untitled Data Source” at the top of your page to a relevant descriptive name. This will help if you create reports for multiple accounts. E.g.: GA4 – My Website.

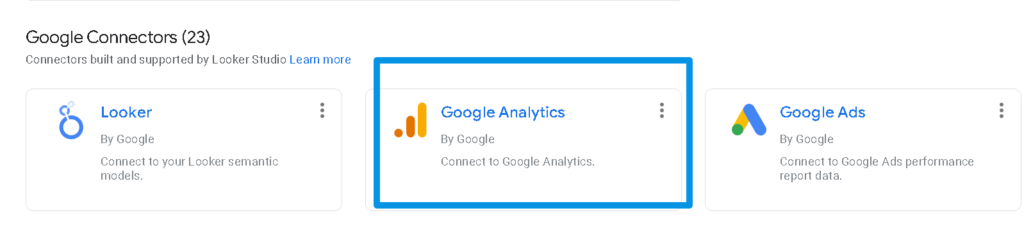
🖱 Step 4.2 – Click Google Analytics in the list of Google Connectors.
🖱 Step 4.3 – Click Authorise

🖱 Step 4.4 – Click the Account you want to create a Looker Studio report for.
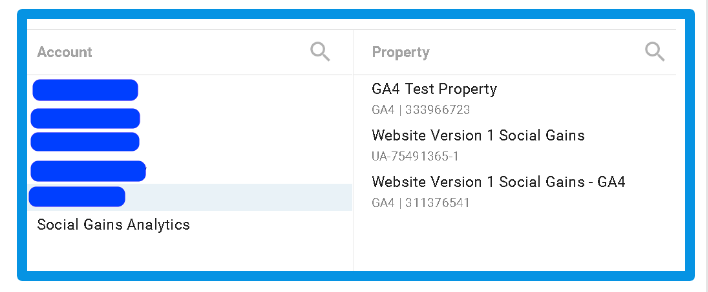
🖱 Step 4.5 – Click the Property of the account.
🖱 Step 4.6 – Click connect.
🖱 Step 4.7 – Click Create Report.
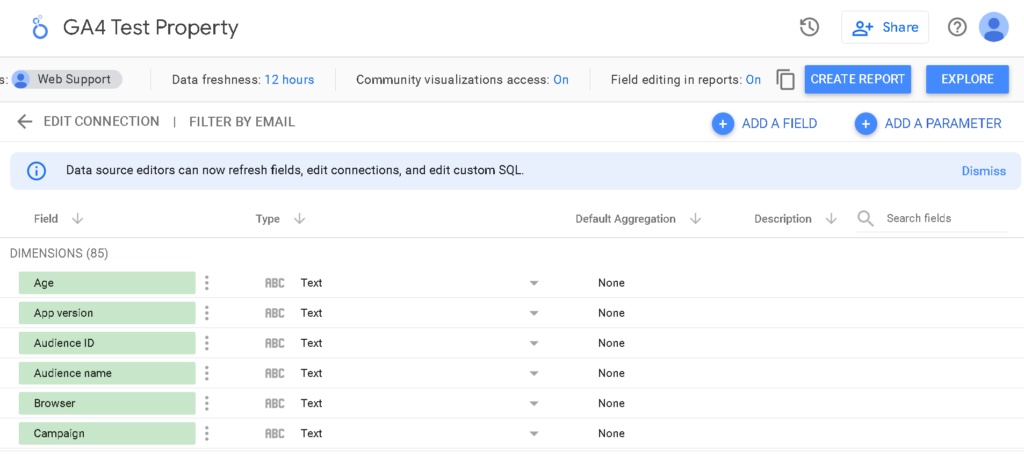
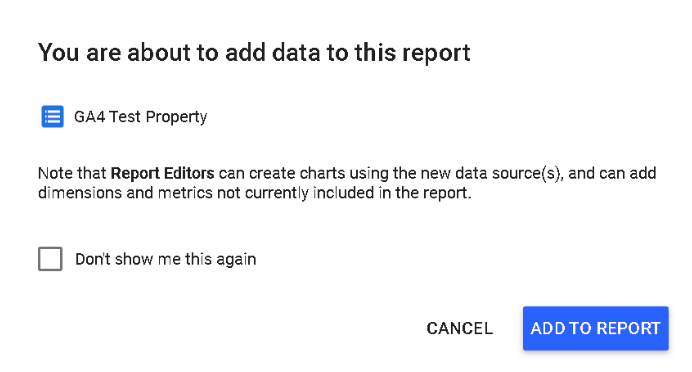
🖱 Step 4.8 – Click Add To Report
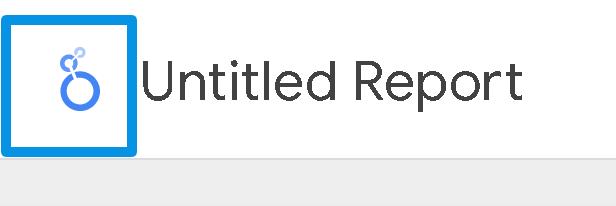
🖱 Step 4.9 – Click on the Looker Studio Logo in the top left corner to head back to your Looker Studio dashboard.
Step 5: Check Your Data Source In Your Looker Studio dashboard
🖱 Step 5.1 – On the homepage of your Looker Studio account, click “Data sources“.
🖱 Step 5.2 – Check if your GA4 connection is listed.
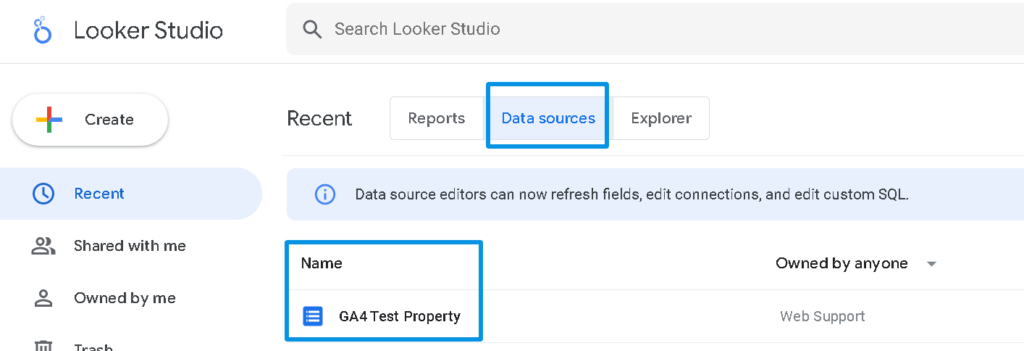
If it’s showing here, you’ve successfully created the GA4 connection with Looker Studio. 🏆 🏆🏆
Key Takeaways
- Start using Looker Studio to visualise the current data available in Google Analytics 4 to generate more comprehensive and detailed insights.
- Looker provides far more flexibility to combine data sources, transform data, and create robust reusable models for reporting.
- Looker Studio unlocks the value of your data to deliver insights with impact and create data experiences tailored for every part of your business.
GA4 is working on a roadmap to introduce new features for Looker Studio for GA4 and is an excellent option if you are looking to take your GA4 reporting to the next level. The future looks bright for Looker Studio, even when factoring in the current GA4 Data API quota.
FAQ’s
View token usage
- Edit your Looker Studio report.
- To see your report’s overall token usage, right-click the report canvas, then choose Google Analytics token usage.
- To see the token usage for a specific component, right-click the component, then choose Google Analytics token usage.
For the overall usage of Google Analytics 4 tokens, you can view:
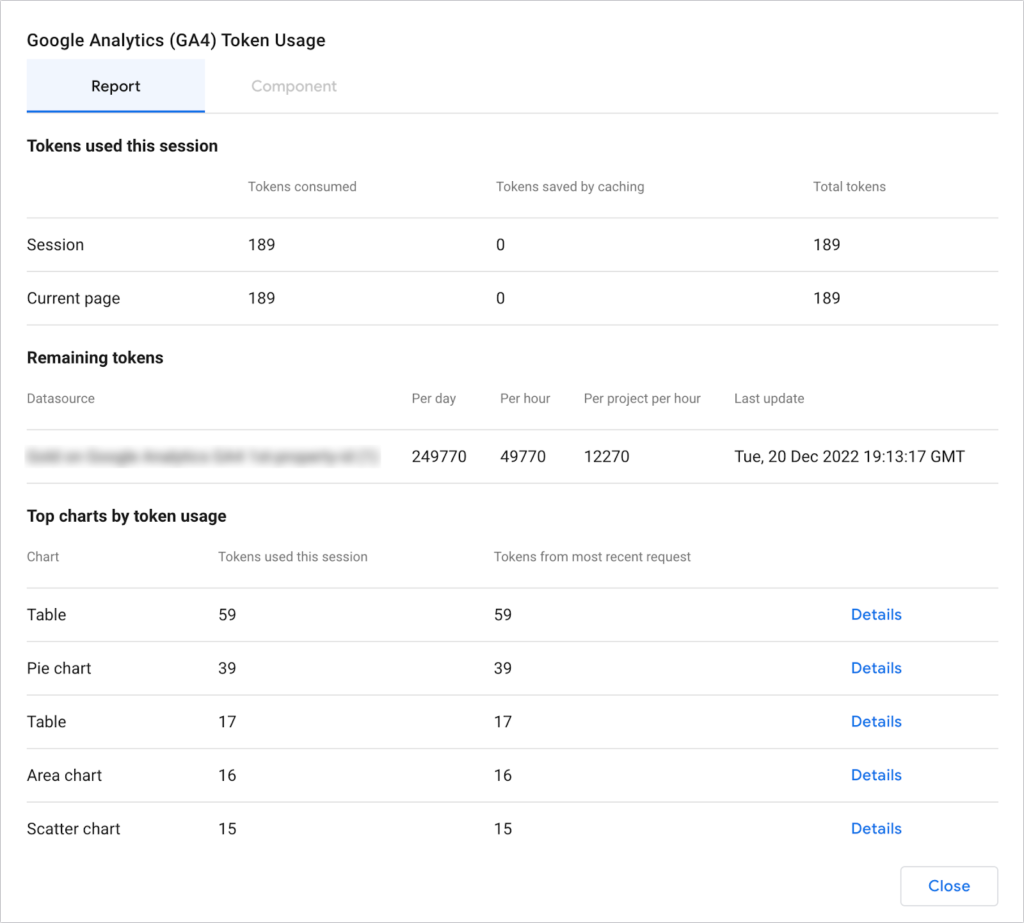
- The number of quota tokens used by the entire report or per page for the current user session
- The number of quota tokens remain available before the quota is reached
- The number of quota tokens are consumed by each chart, sorted by those that use more tokens
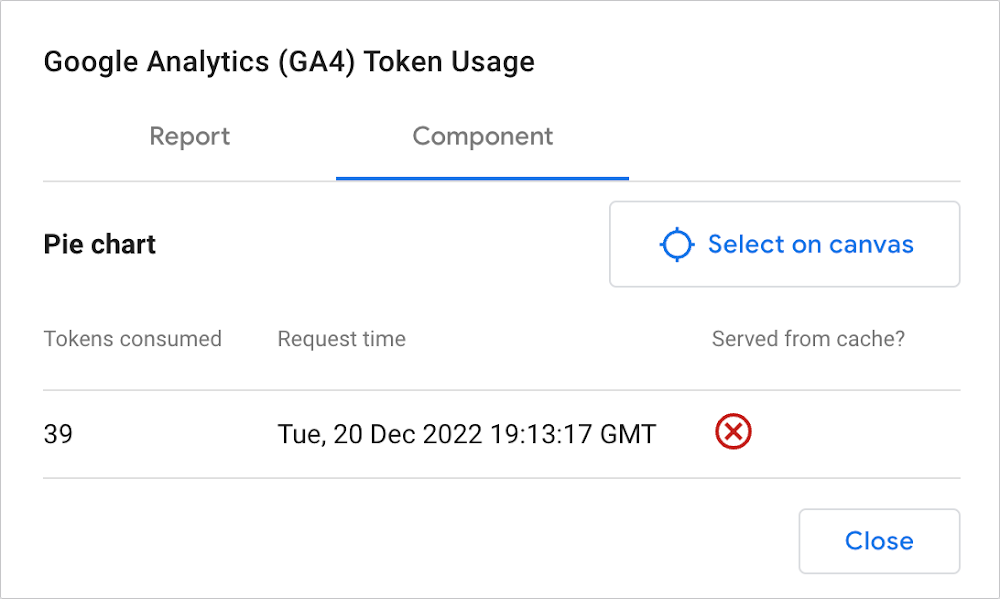
For token usage by a specific component, you can view:
- The number of quota tokens have been consumed by each request
- The time that each request finished
- Whether or not the request was served from cache, where a red X indicates that the request was not served from cache and an encircled green checkmark indicates that the request was served from cache
| Quota Name | Standard Property Limit | Analytics 360 Property Limit |
|---|---|---|
| Core Tokens Per Property Per Day | 25,000 | 250,000 |
| Core Tokens Per Property Per Hour | 5,000 | 50,000 |
| Core Tokens Per Project Per Property Per Hour | 1,750 | 17,500 |
| Core Concurrent Requests Per Property | 10 | 50 |
| Core Server Errors Per Project Per Property Per Hour | 10 | 50 |
| Realtime Tokens Per Property Per Day | 25,000 | 250,000 |
| Realtime Tokens Per Property Per Hour | 5,000 | 50,000 |
| Realtime Tokens Per Project Per Property Per Hour | 1,750 | 17,500 |
| Realtime Concurrent Requests Per Property | 10 | 50 |
| Realtime Server Errors Per Project Per Property Per Hour | 10 | 50 |
| Funnel Tokens Per Property Per Day | 25,000 | 250,000 |
| Funnel Tokens Per Property Per Hour | 5,000 | 50,000 |
| Funnel Tokens Per Project Per Property Per Hour | 1,750 | 17,500 |
| Funnel Concurrent Requests Per Property | 10 | 50 |
| Funnel Server Errors Per Project Per Property Per Hour | 10 | 50 |
Tokens are consumed every time users change filters, edit date ranges or even when refreshing data in a Looker Studio dashboard. Under the free version, you have a limit of 1750 tokens each hour. Once the limit of tokens is reached, the API returns an error.