
Last updated and reviewed: August 2024
Skill level: Beginner to Intermediate
Table of Contents
📣 GA4 not showing data? Look no further! I’ve got you covered with ten top configuration GA4 tips that will help you resolve reporting challenges and potential attribution issues.
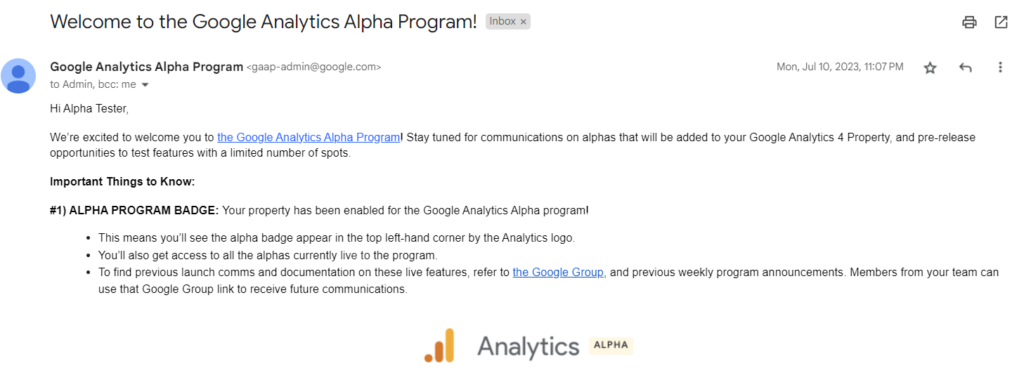
Before we dive into the top ten tips are you familiar with Google Analytics 4 Alpha? You can now get beta access to brand-new features before they are rolled out to the general public.

You can spot the Analytics Alpha badge in my Test property above? I’ve signed my Test Property up to the Alpha program to get a heads-up on any new Beta features before they’re rolled out to the general public. Here’s the link to signup, it’s literally just a Google Form doc. I recommend setting up a test property to use.
Once you get your shiny new Alpha program badge this means your property has been enabled for the Google Analytics Alpha program! You’ll see the alpha badge appear in the top left-hand corner by the Analytics logo. I always recommend setting up a Test Property first.
You’ll also get access to all the alphas currently live in the program. To find previous launch comms and documentation on these live features, refer to the Google Group, and previous weekly program announcements. Members from your team can use that Google Group link to receive future communications.
Once you’re accepted you’ll get an email like this below.
From personal experience navigating attribution challenges can feel like tightrope-walking blindfolded especially when you’re tracking performance across multiple assets and campaigns. You need to strike a delicate balance in capturing precise data and insights.
To help you I’ve created an all-in-one GA4 marketing dashboard. You can get instant access here or by clicking on the image below.
Includes a step-by-step walkthrough on setting up the Dashboard to monitor your entire sales funnel.
Utilise it to track your sales and marketing results, and identify patterns with the most searched and trending SEO keywords. You have my permission to customise the dashboard with your logo or branding.

Without further ado let’s skip these 10 all-too-common blunders and tame your GA4, giving you trustworthy data to analyse and act upon.

“A true hypertrend like AI is a once-in-a-generation moment. This is your chance to step into the internet’s third act and build a business that lasts”.
Even If You Can’t Write a Single Line of Code…
Mistake 1: Failing To Customise Default Lifecycle Reports (Bonus – Play Hide The Sausage🌭)
Guess what doesn’t help? Config mishaps in your GA4 setup. Unfortunately, these blunders cross my path all too frequently. Fortunately, GA4 offers the power to customise the default reports and metrics. Don’t settle for a one-size-fits-all approach – tailor the GA4 interface to showcase the metrics that matter most to your business.

While the default acquisition reports offer marketers valuable insights, there is still room for improvement.
For example, to optimise the effectiveness of your GA4 acquisition reports, you can:
- Change the primary dimensions of your acquisition reports
- Customise acquisition reports with relevant metrics
- Create your acquisition report in explorations
📢📢📢 Genius Tip: Before making these changes below, I recommend making a copy of your Life cycle report so you’ve got a backup of the original.
Head over to Library > Three Vertical Dots and click “Make a copy“.

Let’s start with changing the default dimension in the “Traffic acquisition” reports.
The default dimension in “Traffic acquisition” reports is “Session Default Channel Group“.

My team prefers “Session Source/medium” as the default dimension. It provides more granular detail for high-level analysis.
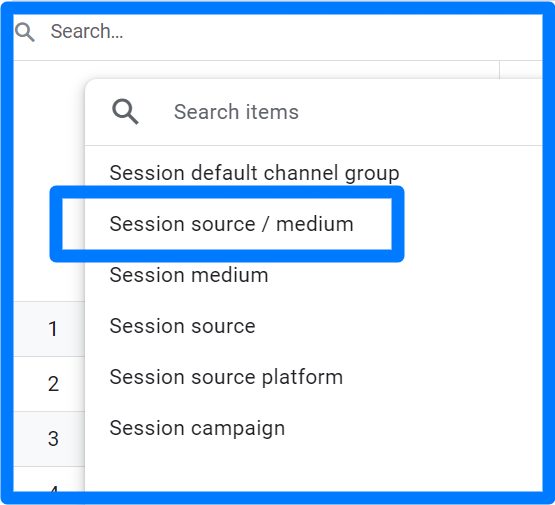
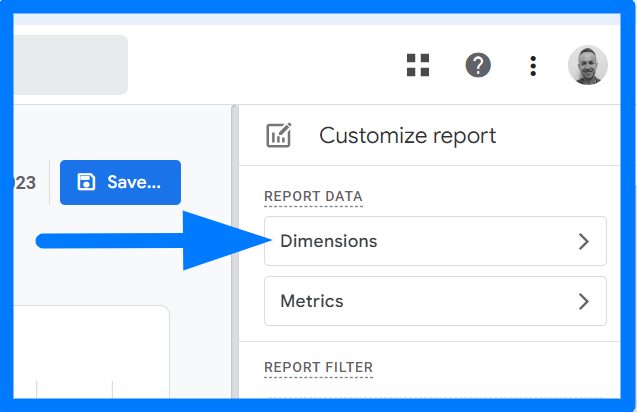
🛠️ Step 1.1: To customise the “Traffic acquisition” report, follow these steps. Access the report and locate the Pencil icon situated in the top-right corner.

🛠️ Step 1.2: Click on Dimensions. Change the default dimension “Session default channel grouping.”
🛠️ Step 1.3: Click on the 3 dots next to “Session Source / medium” dimension, set it as default and click “Save“.
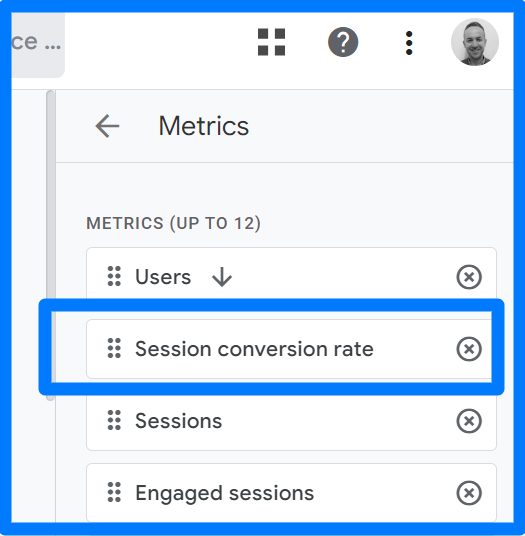
🛠️ Step 1.4: If you’d like to add or remove specific metrics, simply click on the “Metrics” option located in the right sidebar.
To get rid of metrics that you don’t find helpful, click on the “X” next to them.
And if you want to include additional metrics, just click on the “Add metric” button.
📢📢📢 Genius Tip: An additional example metric would be “Session Conversion Rate“. You can then drag this metric to appear in the first column.
🛠️ Step 1.5: It’s time for you to take the reins. Navigate to your “User Acquisition” reports, modify the default dimension, and include your preferred metrics.
These reports identify the very first traffic source for each user that visited your site.
You’ll notice that the dimensions in the “User acquisition” report start with “First user…” Helps understand the effectiveness of different marketing channels in attracting users.
To clarify this report only answers how many users visited from a specific source for the very first time!
Now, let’s talk about Google AdWords – why on earth did Google decide to play hide the sausage🌭 with their Ads report?
It’s like they’re trying to integrate the two systems, but playing hard to get. It’s a bit bonkers that you have to customize a report just to see your Google Ads data. Right now there’s a little Sessions by Session Google Ads Campaign card, but fear not!
I’ve filmed a video to show you how to set up your Ads report in GA4, whether you want a detailed report or go on an exploration adventure! Download the dashboard here and we’ll send you the instructions on how to do it!
Mistake 2: Enhanced Measurement Events…Can We Trust Them?
Enhanced Measurement events have more issues than a complicated love triangle. The top issue for me is Automatic Form Interactions tracking which has been rolled out via enhanced measurement, meaning you can spy on users who dared to flirt with your form but didn’t commit, without any extra coding or tagging.
Sounds dreamy, right? 😉

However, if you have a Facebook pixel installed consider setting up all your form submission events in Google Tag Manager rather than using the automatic form tracking available in enhanced measurement.
Failure to do so may result in a high likelihood of encountering false Form Submit events, as they are not associated with the actual forms present on your website.
And we’ve also experienced issues with the overall event count being inflated. I highly recommend you test this feature in your GA4 Test Property first and see how it goes before rolling it out or as recommended above track your forms with GTM, which is what we do at Social Gains.
Mistake 3: When Data Duplication Goes Wrong: Welcome to Clone Wars. 🌌🔫
First up, we have the mistake of duplicating event data. Yes, you heard it right. It’s like copying your own homework and submitting it twice. So no cheating.
Don’t waste your time by creating events in GA4 if you’ve already done it in Google Tag Manager. Your reports will show duplicate data, and no one likes seeing double.
Ready To Tap In To The AI Goldrush?
Download our 21-page PDF and discover the 4 smartest strategies for building and scaling an AI-driven business that thrives. This is your chance to capitalise on AI’s biggest opportunities, laid out in one actionable guide
Some events are collected automatically, while others require a bit of creativity in Google Tag Manager with the relevant parameters being registered as custom definitions in GA4.
So before you start creating custom events directly in GA4 i.e., GA4 > Admin> Events > Create event ask this question.
Have you already created this event in Google Tag Manager/GTAG?
If so, there is no need to replicate in the GA4 because the event data should appear in your reports automatically as long as you register them as custom dimensions.
Mistake 4: Time flies, but apparently data retention doesn’t!
Now let’s talk about the oh-so-common mistake of neglecting to extend your data retention period. The data in the new GA4 has a disappearing act after just 2 months, unless you step in to save the day.
Just remember, extending the retention period from 2 months to 14 months won’t conjure up the previous 14 months of data.
To do this head over to your Google Analytics 4 property: In the PROPERTY column, click Data Settings > Data Retention. The 14-month retention period starts from the moment you wave your wand and apply the setting.

Take immediate action and change your data retention period before it gets automatically deleted. This will provide you with more opportunities to analyse longer-term data trends and help build better reports.
Mistake 5: Have You Set Up A GA4 Test Property?
Setting up a GA4 test property is a necessity to avoid polluting your live website data with testing data.
Migrating to GA4 is a complex process and the best strategy is to create a GA4 test property with the data separate from your live GA4 environment/property.

Analytics Alpha
Did you spot the Analytics Alpha badge in my Test Account? I’ve signed my Test Property up to the Alpha program to get a heads-up on any new Beta features before they’re rolled out to the general public.
A testing view is a great way to experiment with features without impacting your primary report because if you decide to change a setting in your original GA4 property, you will permanently alter the way the data is collected, processed, and reported in your reporting view.
📢📢📢 Genius Tip: Here are step-by-step instructions on how to set up a Test Property in just 5 minutes.
Mistake 6: Give Those Data-testing Developers A Break! 😉
GA4 has your back with not one, but two data filters:
- Developer Traffic
- Internal Traffic
Developers working their magic on your website or app fall under ‘Developer Traffic’. To remove developer traffic from GA4 reports, you can use the ‘developer traffic’ data filter and apply the ‘Exclude’ filter operation.
Do this in place of using the ‘internal traffic’ data filter. This way, the excluded developer traffic won’t mess up your real-time reporting. You can still analyse the excluded data, by heading over to the DebugView report.
Whereas, Internal traffic includes visits to your website by you, your employees, suppliers, and other service providers.
The DebugView report is like looking straight into the matrix showing unfiltered hit-level data. It’s better for debugging than those real-time reports.
📢📢📢 Genius Tip: Remember if you exclude internal traffic and your own IP address is part of this exclusion then you won’t see any test data in the GA4 real-time report
Mistake 7: Undo Boo-Boos Made by Auto Migration.
The deadline of 1st July marked the official sunset of Universal Analytics (the older version of Google Analytics) though a few accounts were still seeing data flow in their accounts up to a few weeks after the deadline.
During the entire lead-up, Google repeatedly stressed the significance of ‘Auto-migrating‘ to a Google Analytics 4 property. This process aimed to transfer all essential conversion and event data to GA4.
The issue arises when businesses activate this option and struggle to locate and validate their conversion data or they have issues with Google Ads i.e. deflation/inflation with conversions. As a result, they end up spending more time fixing auto-onboarding setups.
Ready To Tap In To The AI Goldrush?
Download our 21-page PDF and discover the 4 smartest strategies for building and scaling an AI-driven business that thrives. This is your chance to capitalise on AI’s biggest opportunities, laid out in one actionable guide
To tackle this challenge, agencies like Social Gains have devised a bespoke and tailored solution that perfectly aligns with business needs. We do acknowledge the well-intentioned efforts by Google, but it seems like it hasn’t quite hit the mark in many instances.
We highly advised against migrating all data from Universal Analytics, as numerous accounts are now inflated and require refinement. If your account has been auto-migrated across and seeing any discrepancies in your account feel free to reach out to support@socialgains.co.uk for help.
Mistake 8: Tweak the timer for engaged sessions, cranking it up to 60 seconds!
The default threshold for engagement time is 10 seconds. Would you label a user as engaged if they barely glance at your website for a mere 10 seconds before taking off?
Let’s stretch that timeframe a bit, shall we?
🛠️ Step 8.1: Navigate to the Admin section and select Data Streams.
🛠️ Step 8.2: From there, choose Configure Tag Settings and click on Show All.

🛠️ Step 8.3: Next, adjust the Session Timeout settings to your desired time, which can be up to 60 seconds. 🕐💻
Mistake 9: Forgetting to mark important goal-type events as conversions.
Don’t forget your conversion events! GA4 does more than just track how a user interacts with your ads.
In GA4, literally, everything becomes an event. Pageviews, scrolls, user engagement – all thrown into the event blender! So, figuring out what’s a true event and what’s a conversion becomes a crucial mission.
Events underpin the success of your GA4 setup. Every interaction that you want to measure is an event. Building an event portfolio from scratch in GA4 without first detailing what is being tracked in the current analytics setup, introduces a significant margin for error and can lead to unnecessary gaps in data streams and the reports they inform.
📢📢📢 Genius Tip: To help get a handle on your events strategy grab a copy of the GA4 Audit Checklist and the Genius Looker Studio dashboard here.

Once your conversions are set up, you can pick your ultimate event champions and examine them in their very own dedicated reports.
The maximum length of an event name is 40 characters the event will not be reported as a conversion if event name is more than 40 characters
So, do yourself a favor and make sure to mark events as conversions in GA4! Toggle them on and off from the events tab (Admin > Events) and watch the data flow!
Mistake 10: Stop Goodbye To Data Loss After 18 Months.
By default, you will lose user-specific data for inactive website users in GA4 every 2 or 14 months based on your current data retention settings.
To avoid this data loss, connect your GA4 property to BigQuery and start collecting GA4 data there.
“BigQuery”, though? What the heck is it? Data warehousing. SQL. Coding. Cloud servers. Storage instances.
Sounds scary!
Well, it doesn’t have to be. For every new tech, there’s a new fear. It is fear of the unknown. Fear of change. BigQuery is no different.
Very simply, BigQuery is the cloud data warehouse component of the Google Cloud Platform. It’s one of the top data warehouses on the market and can help you:
- Save your user-specific data from being deleted.
- You can manipulate GA4 data in ways that are sometimes not possible when using the user interface or the data API.
- You can access unsampled raw events and user-level data.
- Your data is not subject to cardinality limits.
- You actually own your data and you can integrate GA4 data with other data sources.
That being said, I recommend testing BigQuery and exploring its features before activating a live account. You can access a BigQuery Sandbox to try BigQuery at no cost.
You are not required to provide your credit card information to use BigQuery sandbox. BigQuery sandbox users can access the same compute power just as users who have paid, and run SQL queries on both small and large datasets. This makes it easy for new users to get up to speed with BigQuery.
Summary
In today’s post, we discussed a variety of tips to consider when it comes to setting up your Google Analytics 4 (GA4) account.
We talked about the importance of avoiding duplicate event data input; enabling custom dimensions; optimizing data retention limits for 14 months; undoing auto migration boo-boos; avoiding polluting the live website GA4 with testing data; taking the time to mark important events as conversions and lots more.
I’m curious to hear how you fare with the top ten GA4 blunders? Don’t forget to drop any additional ones I might’ve missed in the comments below.
FAQ’s
What Is A Custom Report?

You can locate all your GA4 custom reports encompassing both “Detail” and “Overview” reports in the Library. From there, you have easy access to view important details like the template used, creator information, and report names. Additionally, you have the ability to create and edit collections. Collections are composed of topics, which typically include an overview report and up to ten detail reports.
Should I Turn On Enhanced Measurement?

GA4 Enhanced Measurement (similar to any automated tracking system) relies on a set of assumptions. Therefore, it is paramount to ensure diligent validation of data accuracy. (Refer to the example above reference “form tracking”). Standard interactions are captured along with additional data points, such as the percentage of page scrolled recorded with the scroll event (90% scroll). For automatically collected events and their custom parameters, you need to switch these on via custom dimensions.
What are Custom Dimensions?

Custom dimensions and metrics enable you to report on information about your users and how they interact with your site or app. To view your custom dimension data in the GA4 UI, you’ll need to make sure you’ve enabled and configured these dimensions within GA4 itself, not just by sending the data through your tagging tool like GTM. Dimensions are matched based on parameters and scope, so make sure you match those values with what you set up using GTM or gtag.js.The annoying part is that the GA4 UI only starts picking up custom dimensions once you enable them. So, don’t be surprised if you see entries as “(not set)” in your reports for periods before enabling them. If you have encountered this situation, there is a possibility to recover the data integrating GA4 with BigQuery dataset. As per mistake 10 above, this is why we highly emphasise the importance of linking and integrating with BigQuery for all of our esteemed clients.
Can’t find your saved reports in GA4?
To make sure your reports show up in GA4, give enough time for data to accumulate – it might take up to 72 hours. Check that your Google Analytics ID code is set up correctly through GTM. Use the Google Tag Assistant Extension to spot any tagging hiccups on your website or app. If you spot GA4 filters in real-time reports, remove them. Consider: time needed, data thresholding, date range errors, internal/developer filters, tweaking event rules, ensuring data is sent to the right GA4 property, missing event parameters, “(not set)” occurrences in Google Analytics 4, long event names causing problems, and potential adblocker interference with GA.


